fdmsim.com / amr · Outcomes
AMR Reproduction — Results
The outcomes — measured figures vs Schive 2014's published targets. Distinct from the Logbook (the process). Each card is a claim with its target fixed up front; it stays muted until its phase gate is met, then comes alive with the real figure + verdict. Blind — measured, then compared, never tuned.
Live run progress — the three boxes evolving toward z = 0open dashboard →The headline result we are building toward
Phase 7The core–halo relation M_c ∝ M_h^1/3awaiting
awaiting Phase 7
measured M_c vs M_h for every halo, fit to a power law
Deliverables, in order
Phase 2Soliton profile matches the analytic solutionlive ✓
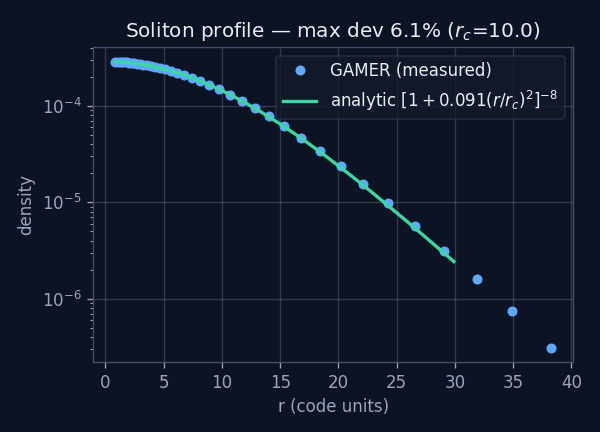
measured · Phase 2 · 2026-06-24
Phase 2★ Convergence proof — ρ_c plateaus (what uniform could not do)live ✓
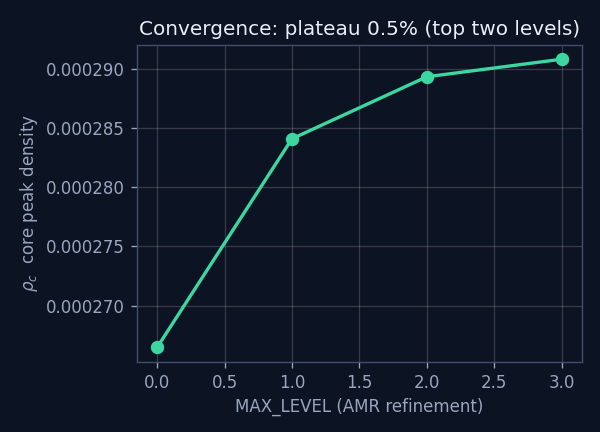
measured · Phase 2 · 2026-06-24
Phase 3Merger energy relation M'_c = α(|E'|/M')^1/2live ✓
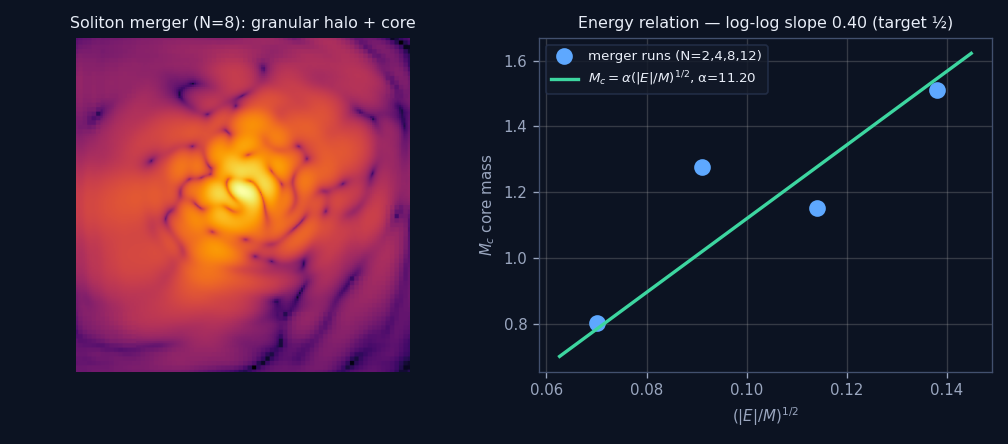
measured · Phase 3 · 2026-06-24
Phase 4Cosmological initial conditions validatedlive ✓
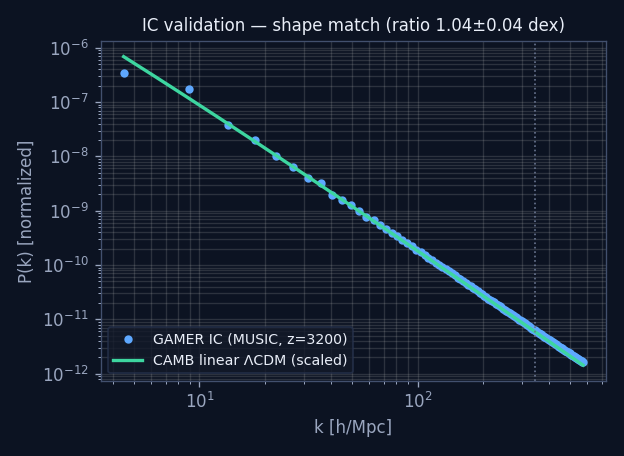
measured · Phase 4 · 2026-06-24
Phase 5Cosmological fingerprints — web · granules · cores · delayed galaxiesawaiting
awaiting Phase 5
a rendered density slice of the evolved box
Phase 8Systematics & error budget · AMR ↔ JAXiON cross-checkawaiting
awaiting Phase 8
β with systematic error bars; two-method comparison